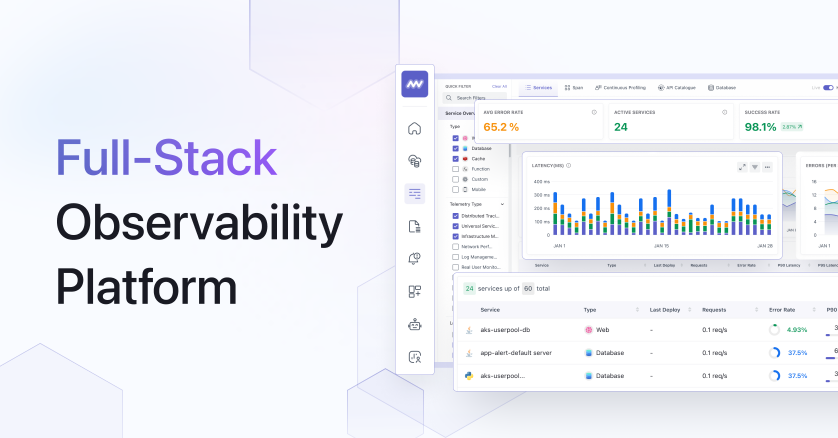
Middleware: AI-Powered Full-Stack Cloud Observability
Middleware is a unified cloud observability platform that monitors infrastructure, logs, and APM with AI-driven insights to slash downtime and boost engineering efficiency.
Overview
Middleware brings every signal from your tech stack—metrics, logs, traces, and events—into one unified observability platform, eliminating the chaos of juggling multiple monitoring tools. Built for modern engineering teams, it uses AI-driven issue detection to surface root causes faster, helping teams move from reactive firefighting to proactive performance management. With a lightweight agent and a powerful query builder, teams can trace the thread from correlation to causation in real time.
Beyond raw visibility, Middleware emphasizes control and efficiency: granular data ingestion controls let you manage costs by only storing what matters, while a unified telemetry view keeps DevOps engineers, SREs, and cloud architects aligned on system health. Paired with enterprise-grade security practices aligned to SOC2 standards, it's designed to scale from solo developers to large organizations without sacrificing speed or trust.
Capabilities & Features
- Observability
- Cloud monitoring
- Infrastructure monitoring
- Log monitoring
- APM
- Metrics
- Distributed tracing
- Database monitoring
- Real user monitoring
- Synthetic monitoring
- Container monitoring
- Serverless monitoring
- AI
- Data ingestion control
Core Features
- Full-stack cloud observability across infrastructure, logs, and APM
- AI-driven issue detection for faster root cause analysis
- Real-time data access and querying
- Granular data ingestion controls to manage costs
- Unified view of telemetry data in one platform
- Built on OpenTelemetry with support for Prometheus and other collectors
Use Cases
- Boosting engineer productivity and app performance with a single observability dashboard
- Reducing mean time to resolution (MTTR) through continuous, real-time monitoring
- Automating workflows to improve developer efficiency
- Controlling observability costs by selectively ingesting and dropping data
- Maintaining uptime and reliability across complex cloud infrastructure
Best For
- DevOps engineers
- Site Reliability Engineers (SREs)
- Software developers
- IT managers
- Cloud architects
Pros
- •Combines infrastructure, logs, and APM monitoring in a single unified platform
- •AI-driven detection helps accelerate troubleshooting and reduce downtime
- •Flexible data ingestion controls prevent unnecessary storage costs
- •Built on open standards like OpenTelemetry, avoiding vendor lock-in
- •Free tier allows teams to test full functionality before committing
Cons
- •Pay-as-you-go pricing based on data volume could become costly at scale without careful ingestion management
- •Data retention is limited to 14-30 days outside of custom enterprise contracts
- •Enterprise pricing is not transparent and requires direct sales contact
- •Reliance on OpenTelemetry agents may require familiarity with the framework for advanced customization
How to Use
1. Sign up and install Middleware's lightweight agent across your infrastructure. 2. Let the agent begin collecting metrics, logs, traces, and events automatically. 3. Use the query builder to explore your telemetry data and uncover patterns. 4. Leverage AI-driven detection to identify anomalies and root causes faster. 5. Apply data ingestion controls to manage what gets stored versus dropped. 6. Monitor dashboards in real time to reduce MTTR and keep systems running smoothly.
Frequently Asked Questions
Connect & Contact
Pricing
Middleware offers a Free Forever plan with monthly usage limits, a Pay-As-You-Go tier billed at $0.30/GB for metrics, logs, and traces, and custom Enterprise pricing with volume discounts and premium support.
Pricing data is provided as a summary. Visit the vendor website for full tier details.