Chat2CSV: Turn CSV Data into Charts with AI Chat
Chat2CSV lets you turn raw CSV files into polished charts just by typing what you want in plain English. No formulas, no coding—just conversation-driven data visualization.
Overview
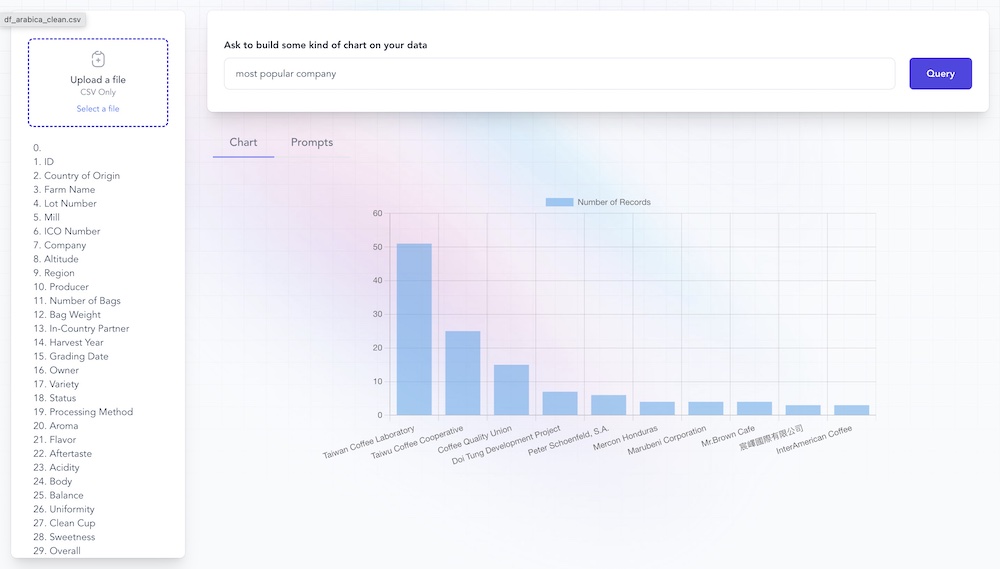
Chat2CSV reimagines data visualization by removing the technical barrier between raw spreadsheets and insightful charts. Instead of wrestling with pivot tables or charting libraries, users simply upload a CSV file and describe the visualization they want in everyday language—like asking for a 'bar chart of sales by region.' The platform's natural language processing engine interprets the request and instantly renders the appropriate chart.
Beyond simple command execution, Chat2CSV includes built-in AI guidance that recommends the most effective chart types based on the structure and content of your data, helping users avoid the guesswork often involved in choosing between bar charts, scatter plots, or pie charts. The platform also emphasizes privacy, processing only the metadata necessary to generate visuals while keeping actual data handling secure.
Whether you're a marketer summarizing campaign performance, a researcher plotting trends, or a business analyst building quick reports, Chat2CSV offers a fast, no-code path from spreadsheet to visual story.
Capabilities & Features
- Data visualization
- Natural language processing
- AI data analysis
- CSV data visualization
- Chart creation
- Data insights
- Business intelligence
Core Features
- Chart generation via natural language prompts
- AI-powered chart type recommendations
- Support for multiple chart formats including bar, pie, line, and scatter plots
- Privacy-focused data handling with metadata-only server processing
- Simple CSV upload workflow with header detection
Use Cases
- Turning regional sales data into comparative bar charts
- Visualizing product sales distribution with pie charts
- Building scatter plots to explore correlations in research data
- Generating quick charts for marketing campaign reports
- Creating classroom-ready visualizations for educational data sets
Best For
- Data analysts
- Business professionals
- Marketing teams
- Researchers
- Educators
Pros
- •No coding or spreadsheet formulas required to create charts
- •AI suggestions help users pick the most effective visualization
- •Supports a broad range of chart types for varied analytical needs
- •Privacy-conscious design keeps sensitive data handling minimal
- •Simple, conversational interface lowers the learning curve
Cons
- •Free tier is limited to a single small CSV file and restricted AI prompts
- •Currently supports only CSV files with headers, limiting format flexibility
- •Larger or more complex files may take longer to process
- •Advanced features like dashboards and chart history are still upcoming, not yet available
How to Use
1. Upload your CSV file (must include headers). 2. Type a natural language request describing the chart you want, such as 'show a pie chart of product sales.' 3. Review the AI-generated chart, and optionally ask the AI for chart-type suggestions. 4. Refine your request in chat form if you need adjustments or a different visualization.
Frequently Asked Questions
Pricing
Chat2CSV offers a free tier with limited queries and a 1MB file cap, while a discounted pre-sale Premium Plan at $15 unlocks larger files, multiple CSVs, and expanded AI prompt allowances.
Pricing data is provided as a summary. Visit the vendor website for full tier details.